Tableau Techniques: Pros and Cons of Blending vs. Joining

Key Takeaways
- With Tableau, you can blend, bend, and join the data according to your needs.
- With data blending, you can get real-time updates regarding any information you want.
- There is always an element of risk involved in data joining. The information can be duplicated.
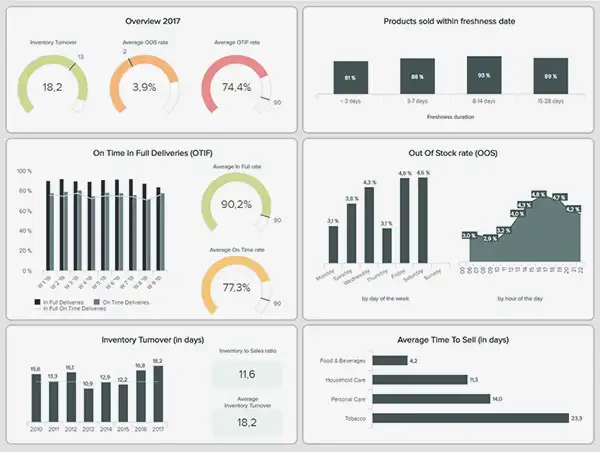
Tableau has become a potent data analysis and visualization tool, enabling businesses to use their data to make wise decisions. The two core strategies that make Tableau’s toolbox are blending and joining. This article explores the various restrictions and advantages of merging and data blending in Tableau.
Understanding Blending
Using Tableau’s blend integration mechanism, users can integrate info from several sources. It offers a mechanism to correlate related stuff without conventional database joins. Blending is helpful when working with sources that can’t be brought together directly.
How to Blend Data in Tableau?
Data from different sources that cannot be directly connected because of different structures or databases are combined using Tableau’s blending feature. The following steps will show you how to combine the information in Tableau:
Connect to Data Sources
- Select your primary source and connect to it. This will be the main source to which you’ll blend other sources.
Add Secondary Data Source
- After connecting to the primary source, go to the “Data” pane on the left.
- Click “Add” under the “Connections” section to connect to your secondary sources.
Define Relationships
- In the “Data” pane, your primary and secondary sources are listed.
- Drag a field from the primary source and drop it onto a corresponding field in the secondary source. This establishes a relationship between the two sources.
Configure Relationship
- Click on the link icon to open the “Edit Relationships” dialog.
- Configure how the information should be blended by specifying which fields to use for the relationship.
Work with Blended Data
- Once the relationships are defined, you can use blended info in your worksheets.
- Create a worksheet by dragging dimensions and measurements onto the Rows and Columns shelves.
Pros of Blending
Even if the databases or connections have distinct formats or schemas, you can integrate data via blending. This flexibility is particularly helpful when working with various sources that are difficult to combine via a conventional join.
Reduced data duplication
Because blending doesn’t produce a new combined dataset, it helps prevent duplication. Instead, it allows for the correlation of pertinent data while preserving the original sources.
Real-time updates
Data blending can be used with dynamic sources since it supports real-time data changes.
Cons of Blending
Blending and joining may execute at different speeds, especially when working with huge datasets. Response times could be impacted by the need to query each source separately.
Limited functionality
When working with blended data, your analytical powers may be constrained by limits in some Tableau features, such as calculated fields and quick table calculations.
Complexity in setup
The linkages between sources, dimensions, and measures must be carefully considered during configuring data blending, which can be difficult and time-consuming.
To have further insights, take a look at this video https://youtu.be/HM81vShSlWY.
Exploring Joining
Data joining entails integrating information from various tables within the same source based on shared fields or keys. When working with structured information contained in a single database, this technique is especially suitable since it uses the relational structure of databases.
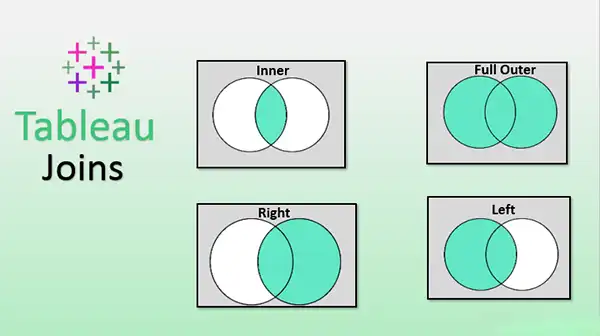
Let’s take a look at the different types of join:
Inner Join
Only the rows that match the given columns in both tables are returned by an inner join. The result set does not include any rows for no matching values.
Left Join
Any matching rows from the right table are returned along with all the rows from the left table in a left join. The row from the left table will still be included in the result if there is no match in the right table, but the columns from the right table will have NULL values.
Right Join
Compared to a left join, a right join is a reverse. The entire right table, as well as the matched rows from the left table, are returned. The row from the right table will be included in the result if there is no match in the left table, and the columns from the left table’s rows will have NULL values.
Pros of Joining
Here we have discussed some advantages:
Advanced Analytics
Tableau’s analytical tools and features are available when joining data, enabling you to carry out intricate computations and visualizations easily.
Enhanced Data Integrity
As it acts within a single database context, data joining minimizes the possibility of mistakes and anomalies and assures details consistency and integrity.
Cons of Joining
Data joining might not be an option if your research needs details from separate databases or systems. The disadvantages are:
Data Duplication
Due to the fact that joining generates a new dataset that contains collections from both linked tables, duplicate collections can be produced. This can result in higher storage needs.
Complexity in Schema Design
Sometimes it might be difficult to handle changes to the schema or structure of the connected tables, which might require changing the model.
Choosing the Right Technique
Utilizing blending or joining depends on several variables, each appropriate for a particular situation.
Data Source Variety
Data blending might be better if your research calls for merging information from different sources with different structural characteristics.
Performance Criteria
Joining within the same source may produce better results when working with huge datasets.
Adaptability in Analysis
Due to its perfect integration with Tableau’s analytical capabilities, joining may be preferred if your study involves intricate computations and sophisticated visualizations.
Parting Words
The typical annual salary for a Tableau developer in the United States is $117,000. Tableau’s blending and joining algorithms have specific benefits and drawbacks in analysis and visualization. Whereas joining improves efficiency and enables advanced analytics within a single source, blending offers flexibility in combining data from different sources.
The decision between these methods depends on variables such as the variety of sources, the necessary level of performance, and the analytical flexibility. Understanding the advantages and disadvantages of blending and joining will help you make the most of Tableau’s ability to drive insightful decision-making from your data.

Her coherent piece of information has helped thousands of people across the globe as well as created a significant positive impact on the readers' lives. She solemnly believes that creating genuine content that educates people is also social work and bliss that she feels gratitude for.


