Parabolic SAR and Bitcoin: Identifying Potential Reversals

Understanding market volatility is of paramount importance for every financial trade analyst to gain more control over their investments. The Parabolic Stop and Reverse (SAR) is a leading indicator tool that helps companies identify potential sudden changes and make informed decisions.
Though there are many methods that seasonal traders use to maintain a stable position, having a technical mechanism that simplifies the entire process without much risk.
By checking for immediate increase or decrease in the price movement, the traded assets can be secured timely. It can also provide quick entry and exit points for traders and therefore avoid big losses.
In this article, we’ll delve into the process of effectively utilizing the Parabolic SAR indicator to identify potential reversals and how they impact Bitcoin trading.
Understanding Parabolic SAR
Investing in cryptocurrency and understanding the trending markets becomes convenient with the Parabolic SAR indicator. According to its developer J. Wilder, traders should establish the direction of a trend by using the SAR tool and then use alternative indicators to control assets.
Graphically, it appears on a chart in a series of dots, with the prices moving either upwards or downwards. If the system shows that the dots are below the current price, it indicates a bullish signal. Whereas, if the position of the dots is above the current price, it is a bearable signal.
The sooner the potential reversals are identified, the quicker it becomes to make the necessary changes to set stop losses and target profits accordingly.
THINGS TO CONSIDER
Traders should understand that the sell signals on the parabolic SAR are much more reliable when an asset trades under a long-term moving average.
How Does Parabolic SAR Work?
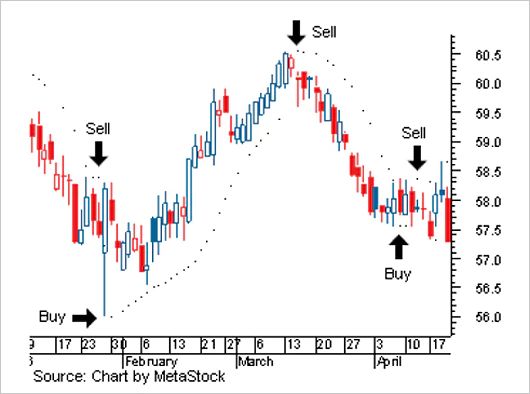
Following leading indicators is the first step towards securing valuable investments, and SAR works to maintain an appropriate trading rhythm. The indicative chart represents assets with a set of dots that are placed near the price bars.
When the dots move above the price, it is noteworthy of a downward trend, prompting traders to sell. Likewise, if the dots stagger and move below the price, it means that the trend of the asset is upward, which is a signal to buy.
However, traders should be careful of the way they use these tools, as sometimes it may produce false signals when the price is moving sideways. In this scenario, investors may incur small losses or profits.
Advantages of Using Parabolic SAR for Bitcoin Trading
Apart from trend trading, Bitcoin transactions can be utilized for setting stop-loss orders by moving them to match the level of the SAR indicator. Other tools provide better investment opportunities that shouldn’t be ignored. However, when trends drive markets for higher profitability, calculating the moving average of prices can help filter out less reliable signals.
Maintaining consistency is the real game in trading, especially with Bitcoin. Specific price points are rarely fixed, but being aware of the dot crossover signals is key.
There are various advantages of using PSAR for Bitcoin trading, and some are listed below:
- It provides clear indicators that are easy to access and visual cues on when to buy and sell crypto.
- It may be applied to any type of cryptocurrency at any time frame as per the changing trends and awareness of the investor.
- It also complements other tools that could be used along with it to avoid heavy losses, such as oscillators or volume indicators.
The graph below shows that the US cryptocurrency exchange has been a constantly growing platform since 2020 and is predicted to increase further till 2030. Therefore, using trading analysis tools helps traders invest mindfully.

Avoid Common Mistakes When Using the PSAR
From experienced traders to new investors, some common mistakes can be avoided when using the PSAR.
The indicator tools are to assist the businesses and should not be used as an invincible or stable process. It helps to maintain a balance of investments, avoiding heavy losses and making informed decisions to make profits.
Overleveraging creates a space for traders that will lead them to a downward spiral, quickly losing valuable assets. Practicing sound risk management is imperative for consistent growth.
Many times, overeager investors enter immediately to grab the profits without waiting for indicator confirmation. After checking the trend on PSAR, they should at least wait for another dot before entering a new trend.
Conclusion
Trading Bitcoin is the newest and trendiest way to make good profits, and therefore a robust strategy has always proved effective. By using the Parabolic SAR tool, investors stay abreast of the latest trends and price movements.
The easy visual representation helps enterprises gain knowledge of the correct timing of buying or selling assets. Making an informed decision is easier by using trading technical analysis tools that assist businesses in avoiding common mistakes.
For successful trading, Parabolic SAR is an invaluable tool for technical analysis of the changing trends guiding you in the dynamic world of financial markets.

Education:


