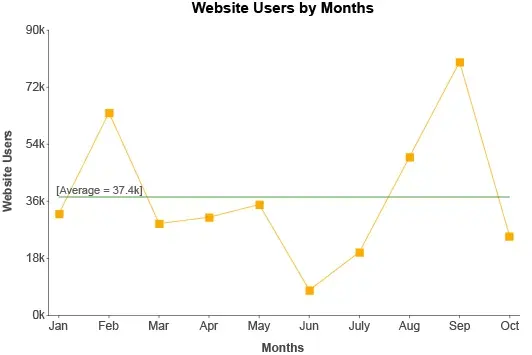
A Guide to Reading a Combination Chart


Understanding combination charts is an elemental skill for anyone who needs to interpret complex data or visualize information. They are versatile tools used effectively in the field of data analytics, research, business, and statistics. When you’re first reading a combination chart, it can be tiresome.
However, once you figure out the basics, it becomes a basic tool in info presentation and data analysis. Keep reading for an insightful journey into combination charts.
Understanding the Basics of a Combination Chart

Combination charts, as the name suggests, are a blend of two or more graph types in a single graph. They allow for a layered visualization of multiple input sets, which aids a more robust and holistic analysis.
The most common mixture involves line, column, or bar charts, each representing different aspects or variables. As complex as they may sound, this bar helps simplify the representation of multifaceted data.
For instance, if you’re doing a sales analysis over a specific period, this graph would be a way to illustrate total sales (as a column), and the percentage change (as a line). This illustrates how they can elucidate correlations between diverse information types over time.
These charts mainly consist of three types: Simple, grouped, and stacked combination tables. To explain further, a simple graph is used for dual axes. For example, to determine the trend of the monthly targeted sales vs actual selling numbers.
Whereas, a grouped chart combines two or more graph types into a single chart. And finally, a stacked graph is created in horizontal or vertical bars broken down into different categories.
Do You Know?
Combination charts let you merge multiple tables in a single chart to compare and analyze data faster and easily.
Importance of Combination Charts in Data Visualization

Combination charts greatly enhance data visualization, allowing for a comprehensive view of complex scenarios. They provide the ability to correlate different but related variables, which is imperative in decision-making processes.
In today’s input-driven world, figuring out the significance of every piece of information is critical. These graphs can effectively illustrate relationships and trends between separate data sets, promoting greater comprehension and strategic planning.
For example, a business can use these tables to visualize both revenue and expenses simultaneously. That way, they not only track the total amount of each but also monitor flows and foresee potential issues.
This is why professionals in a variety of fields, like marketers, accountants, analysts, and researchers, utilize these bars to demonstrate and predict patterns and trends.
Step-by-Step Guide To Deciphering a Combination Chart
Reading a combination chart should be undertaken systematically to avoid confusion and errors. Start by identifying the elements mentioned above – the axes, the data series, and their corresponding aspects in the legend and labels.
Following this, determine the purpose of the graph. Understanding why the chart was created is key to reading it correctly. Ask yourself what relationships or trends this table is intended to display. This context aids in drawing the right conclusions.
Next, evaluate every info course independently. Take note of any plotted points, flows, or patterns. Does one info series seem to directly affect another? Is there an observable correlation?
Lastly, consider all data series collectively. By scrutinizing the relationships between each course, valuable insights can be gleaned. It’s here in these correlations and trends that the primary value of these charts lies.
Mistakes to Avoid When Reading a Combination Chart

While these charts offer a detailed overview of data, understanding them can pose a challenge. It’s vital to avoid common mistakes to ensure an accurate interpretation.
One of the biggest missteps is over-complication. Overloading them with too many information series can lead to confusion rather than clarity. A max of two or three separate table types is typically adequate.
Ignoring the scale of measurement can also distort the input interpretation. Since these graphs often use a dual-axis, the values on one may be drastically different from the other. It’s fundamental to figure out this when interpreting the data.
Lastly, not taking into account the context can lead to incorrect deductions. Remember that the way the series interact with each other is a reflection of the scenario they represent. Thus, always consider the larger picture.
Conclusion
Being able to read a combination chart is a pivotal skill in today’s input-saturated world. As they allow you to see multiple data in a single page, saving space, and making it easier to compare input, mastering it will enable you to transform complex information into clear, insightful data visualizations.


